Comparing to Other References
- Conventions
- Bertaina and Giorgini, Phys. Rev. Lett. 106, 110403 (2011)
- Beane et al. Phys. Rev. A, 107:043314 (2023)
- Bertaina, EPJ Special Topics, 217(1):153–162, (2013)
- Boettcher et al., Phys. Rev. Lett. 116, 045303 (2016)
- Pilati, Orso, Bertaina. Phys. Rev. A, 103:063314, (2021)
- Galea et al., Phys. Rev. A, 93(2):023602 (2016)
- Shi, Chiesa, and Zhang, Phys. Rev. A 92, 033603 (2015)
- Adding a Reference
We provide some utilities for drawing figures with data from the above sources.
- tdg.references.REFERENCES
The
referencesparameters in the functions below expects a set of modules; each module represents a different reference.This variable contains all available references.
Some references have data that has been superseded by works from the same author, or are far outside the typical parameter range. Pass a truthy include_all kwarg to include these in comparison figures. (For an example see PRL106110403.)
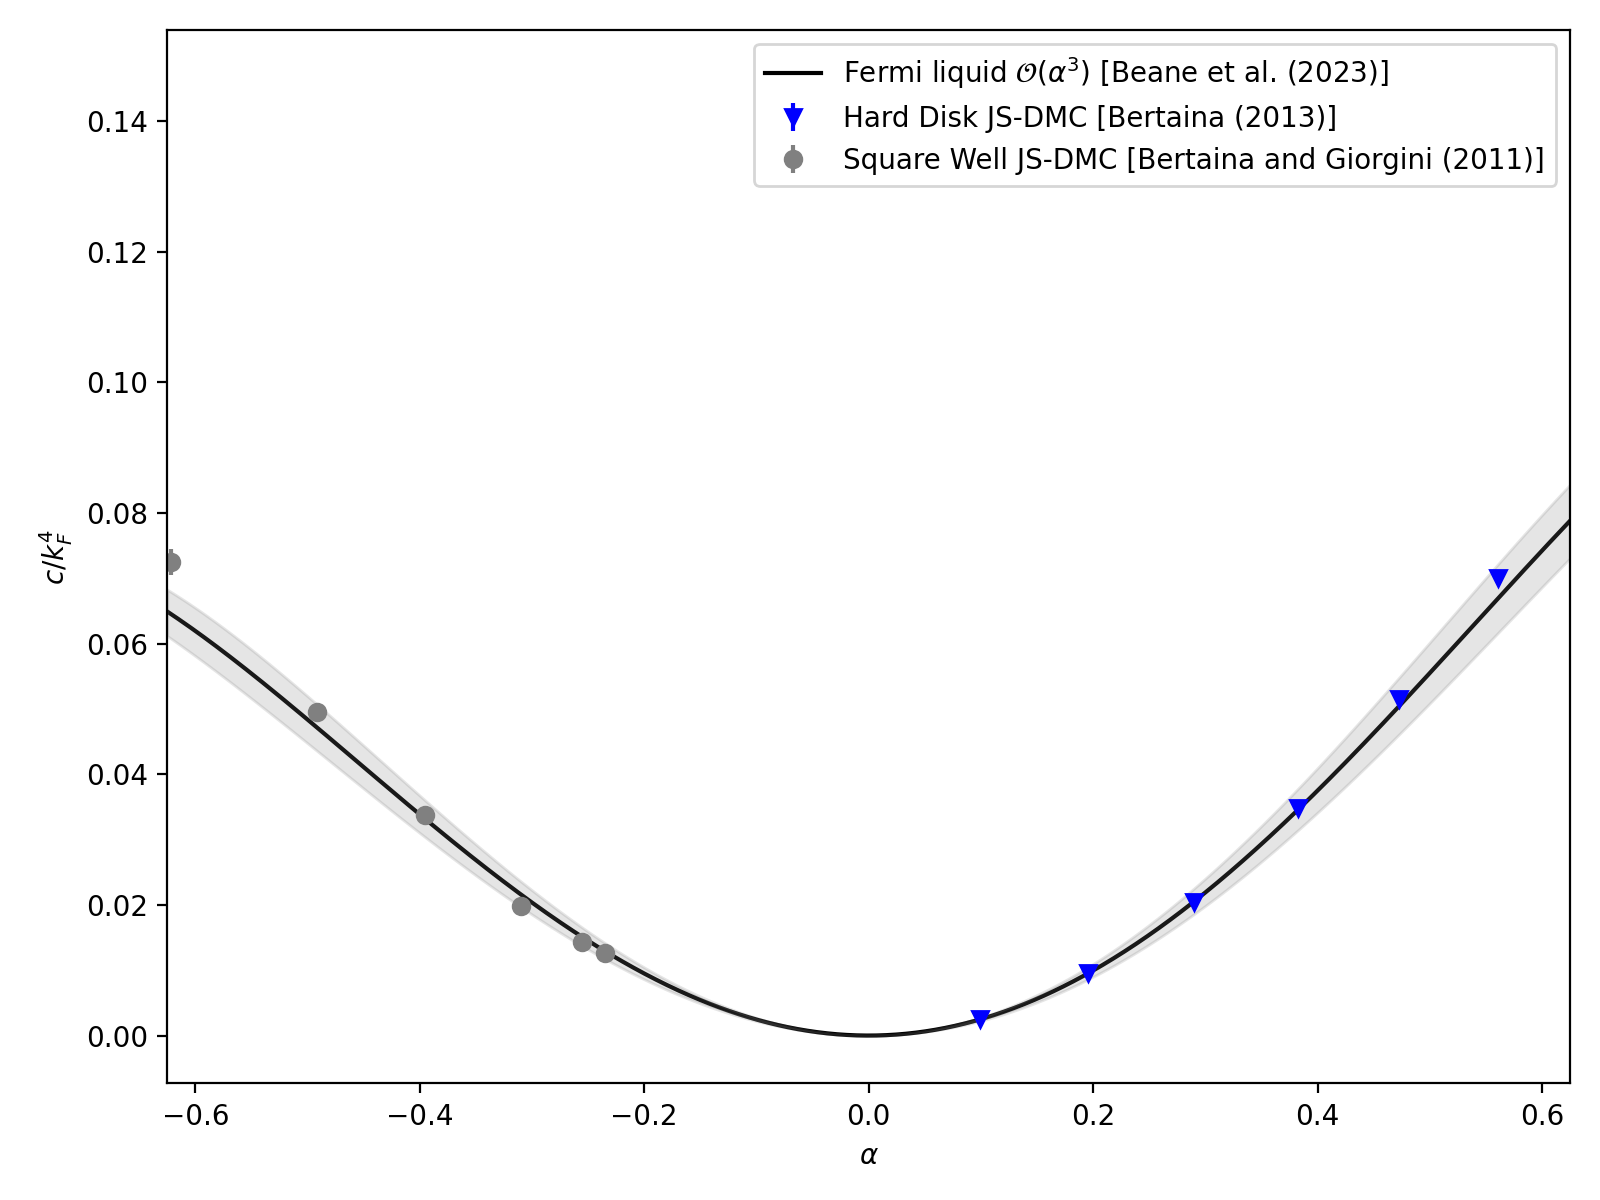
- tdg.references.contact_comparison(ax, *, references=REFERENCES, **kwargs)[source]
Plots the values of \(c/k_F^4\) provided by different references for comparison with
contact_by_kF4().- Parameters
ax (matplotlib axis) – Where to plot the references’ results.
alpha (torch.tensor) – If a reference provides a function (rather than just points), pass alpha to it. Also sets the limits for the x-axis of the plot.
#!/usr/bin/env python

import torch
import matplotlib.pyplot as plt
import tdg.references

fig, ax = plt.subplots(1,1, figsize=(8,6))

alpha = torch.linspace(-0.625, +0.625, 1000)
tdg.references.contact_comparison(ax, alpha=alpha)

ax.set_xlim([min(alpha), max(alpha)])
ax.legend()
fig.tight_layout()
plt.show()
(
Source code,png,hires.png,pdf)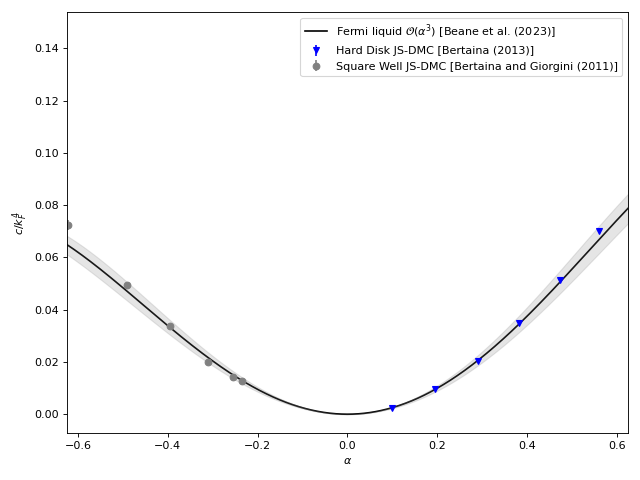
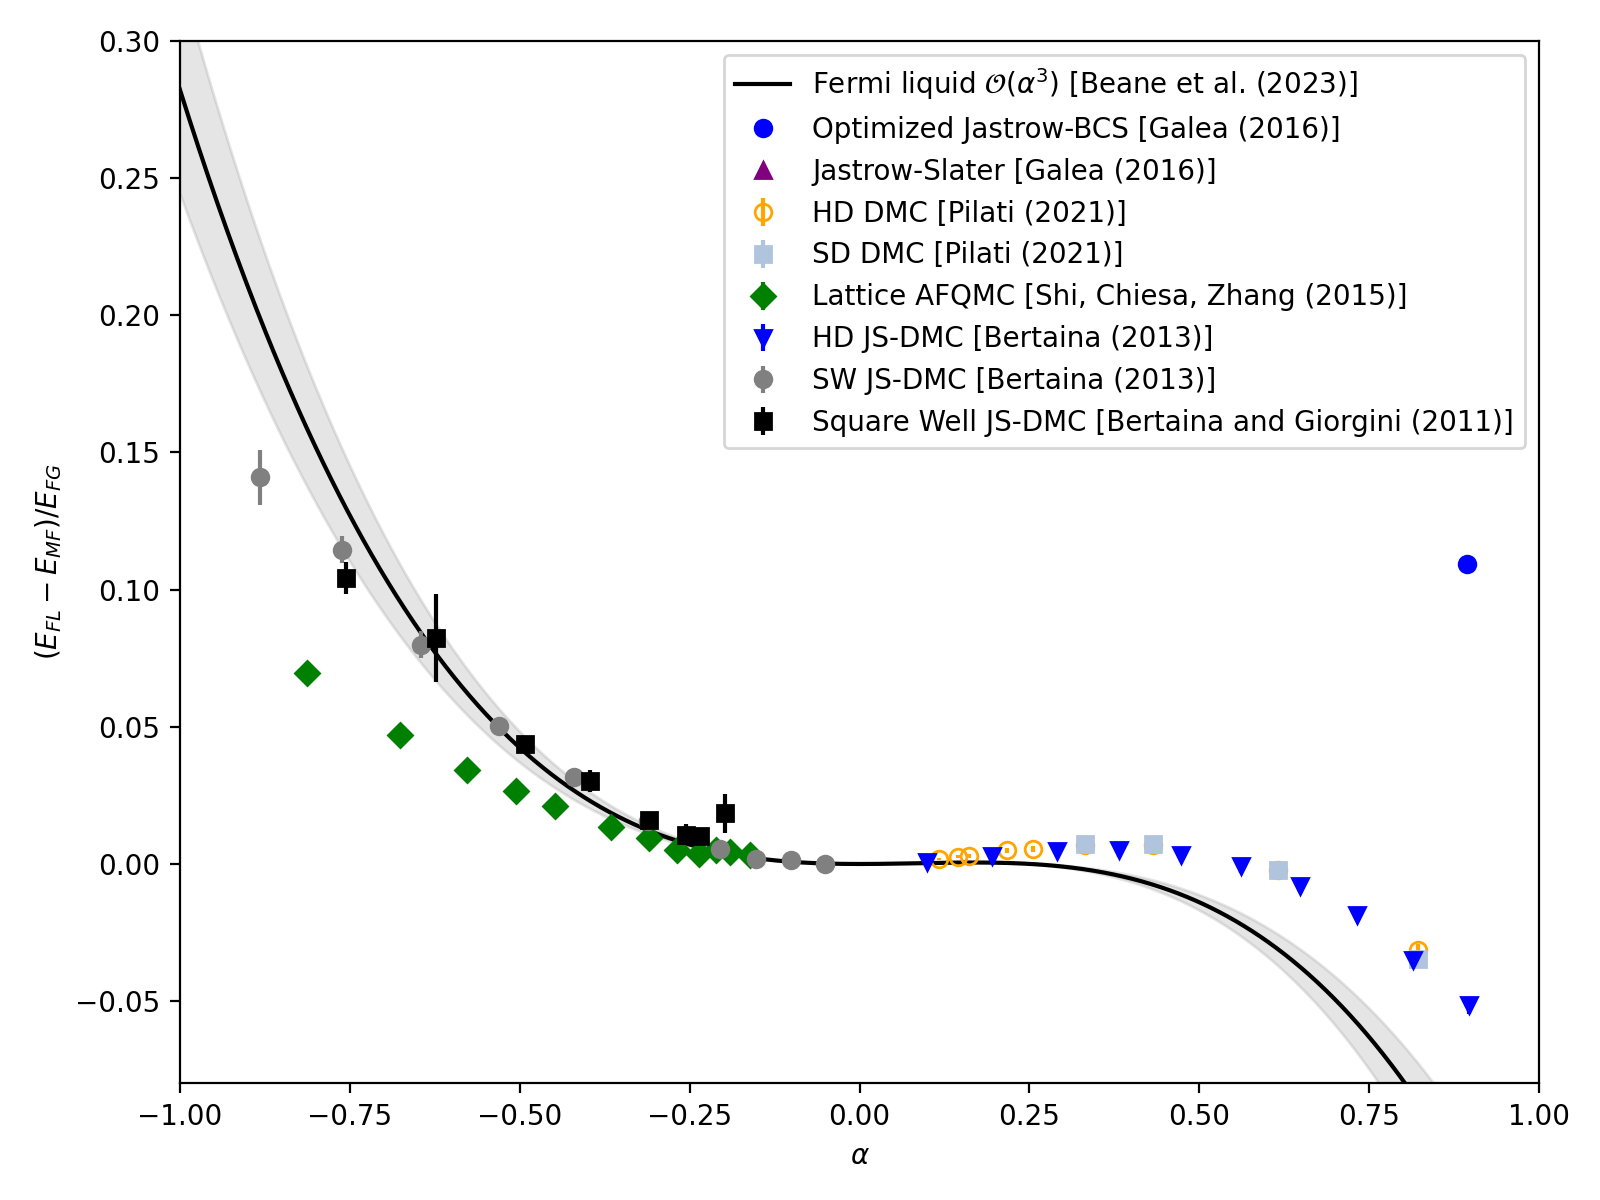
- tdg.references.energy_comparison(ax, *, references=REFERENCES, **kwargs)[source]
Plots the difference between the Fermi Liquid and Mean Field energies normalized by the energy of the free Fermi Gas, \((E_{FL}-E_{MF})/E_{FG}\).
- Parameters
ax (matplotlib axis) – Where to plot the references’ results.
alpha (torch.tensor) – If a reference provides a function (rather than just points), pass alpha to it. Also sets the limits for the x-axis of the plot.
#!/usr/bin/env python

import torch
import matplotlib.pyplot as plt
import tdg.references

fig, ax = plt.subplots(1,1, figsize=(8,6))

alpha = torch.linspace(-1.0, +1.0, 1000)
tdg.references.energy_comparison(ax, alpha=alpha)

ax.set_xlim([min(alpha), max(alpha)])
ax.set_ylim([-0.08, 0.3])
ax.legend()
fig.tight_layout()
plt.show()
(
Source code,png,hires.png,pdf)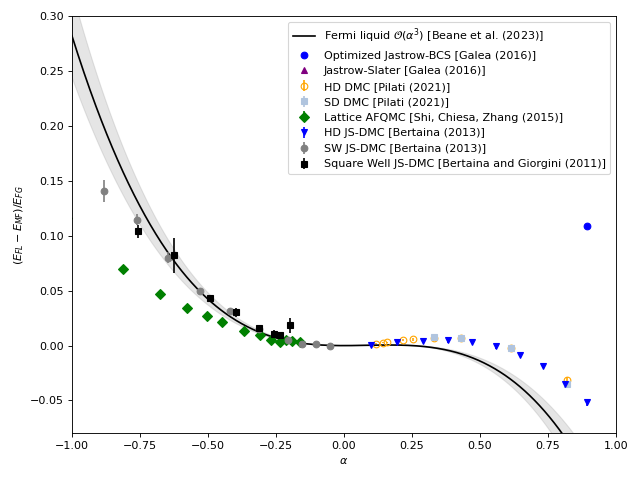
Some references provide equation of state information.